Time and climate (MJO, BSISO, ENSO), IBTrACS and location
Months
Atlas-derived peak class
Climate at genesis
Catalogue association
Endpoint geography
Catalogue percentiles
Coloured marks show models with output valid on each date.
Forecast tracks and weather
Google Cloud Storage · © 2024-6 Google LLC, whose machine learning models were used to create the experimental data made available under the following licence terms https://storage.googleapis.com/weathernext-public/terms-of-use.pdf. This data is intended for experimental modelling only and is not intended, validated, or approved for real world use.
Storm evolution
Forecast verification
Verification evidence loads with the archive.
System explorer
Tracks and density
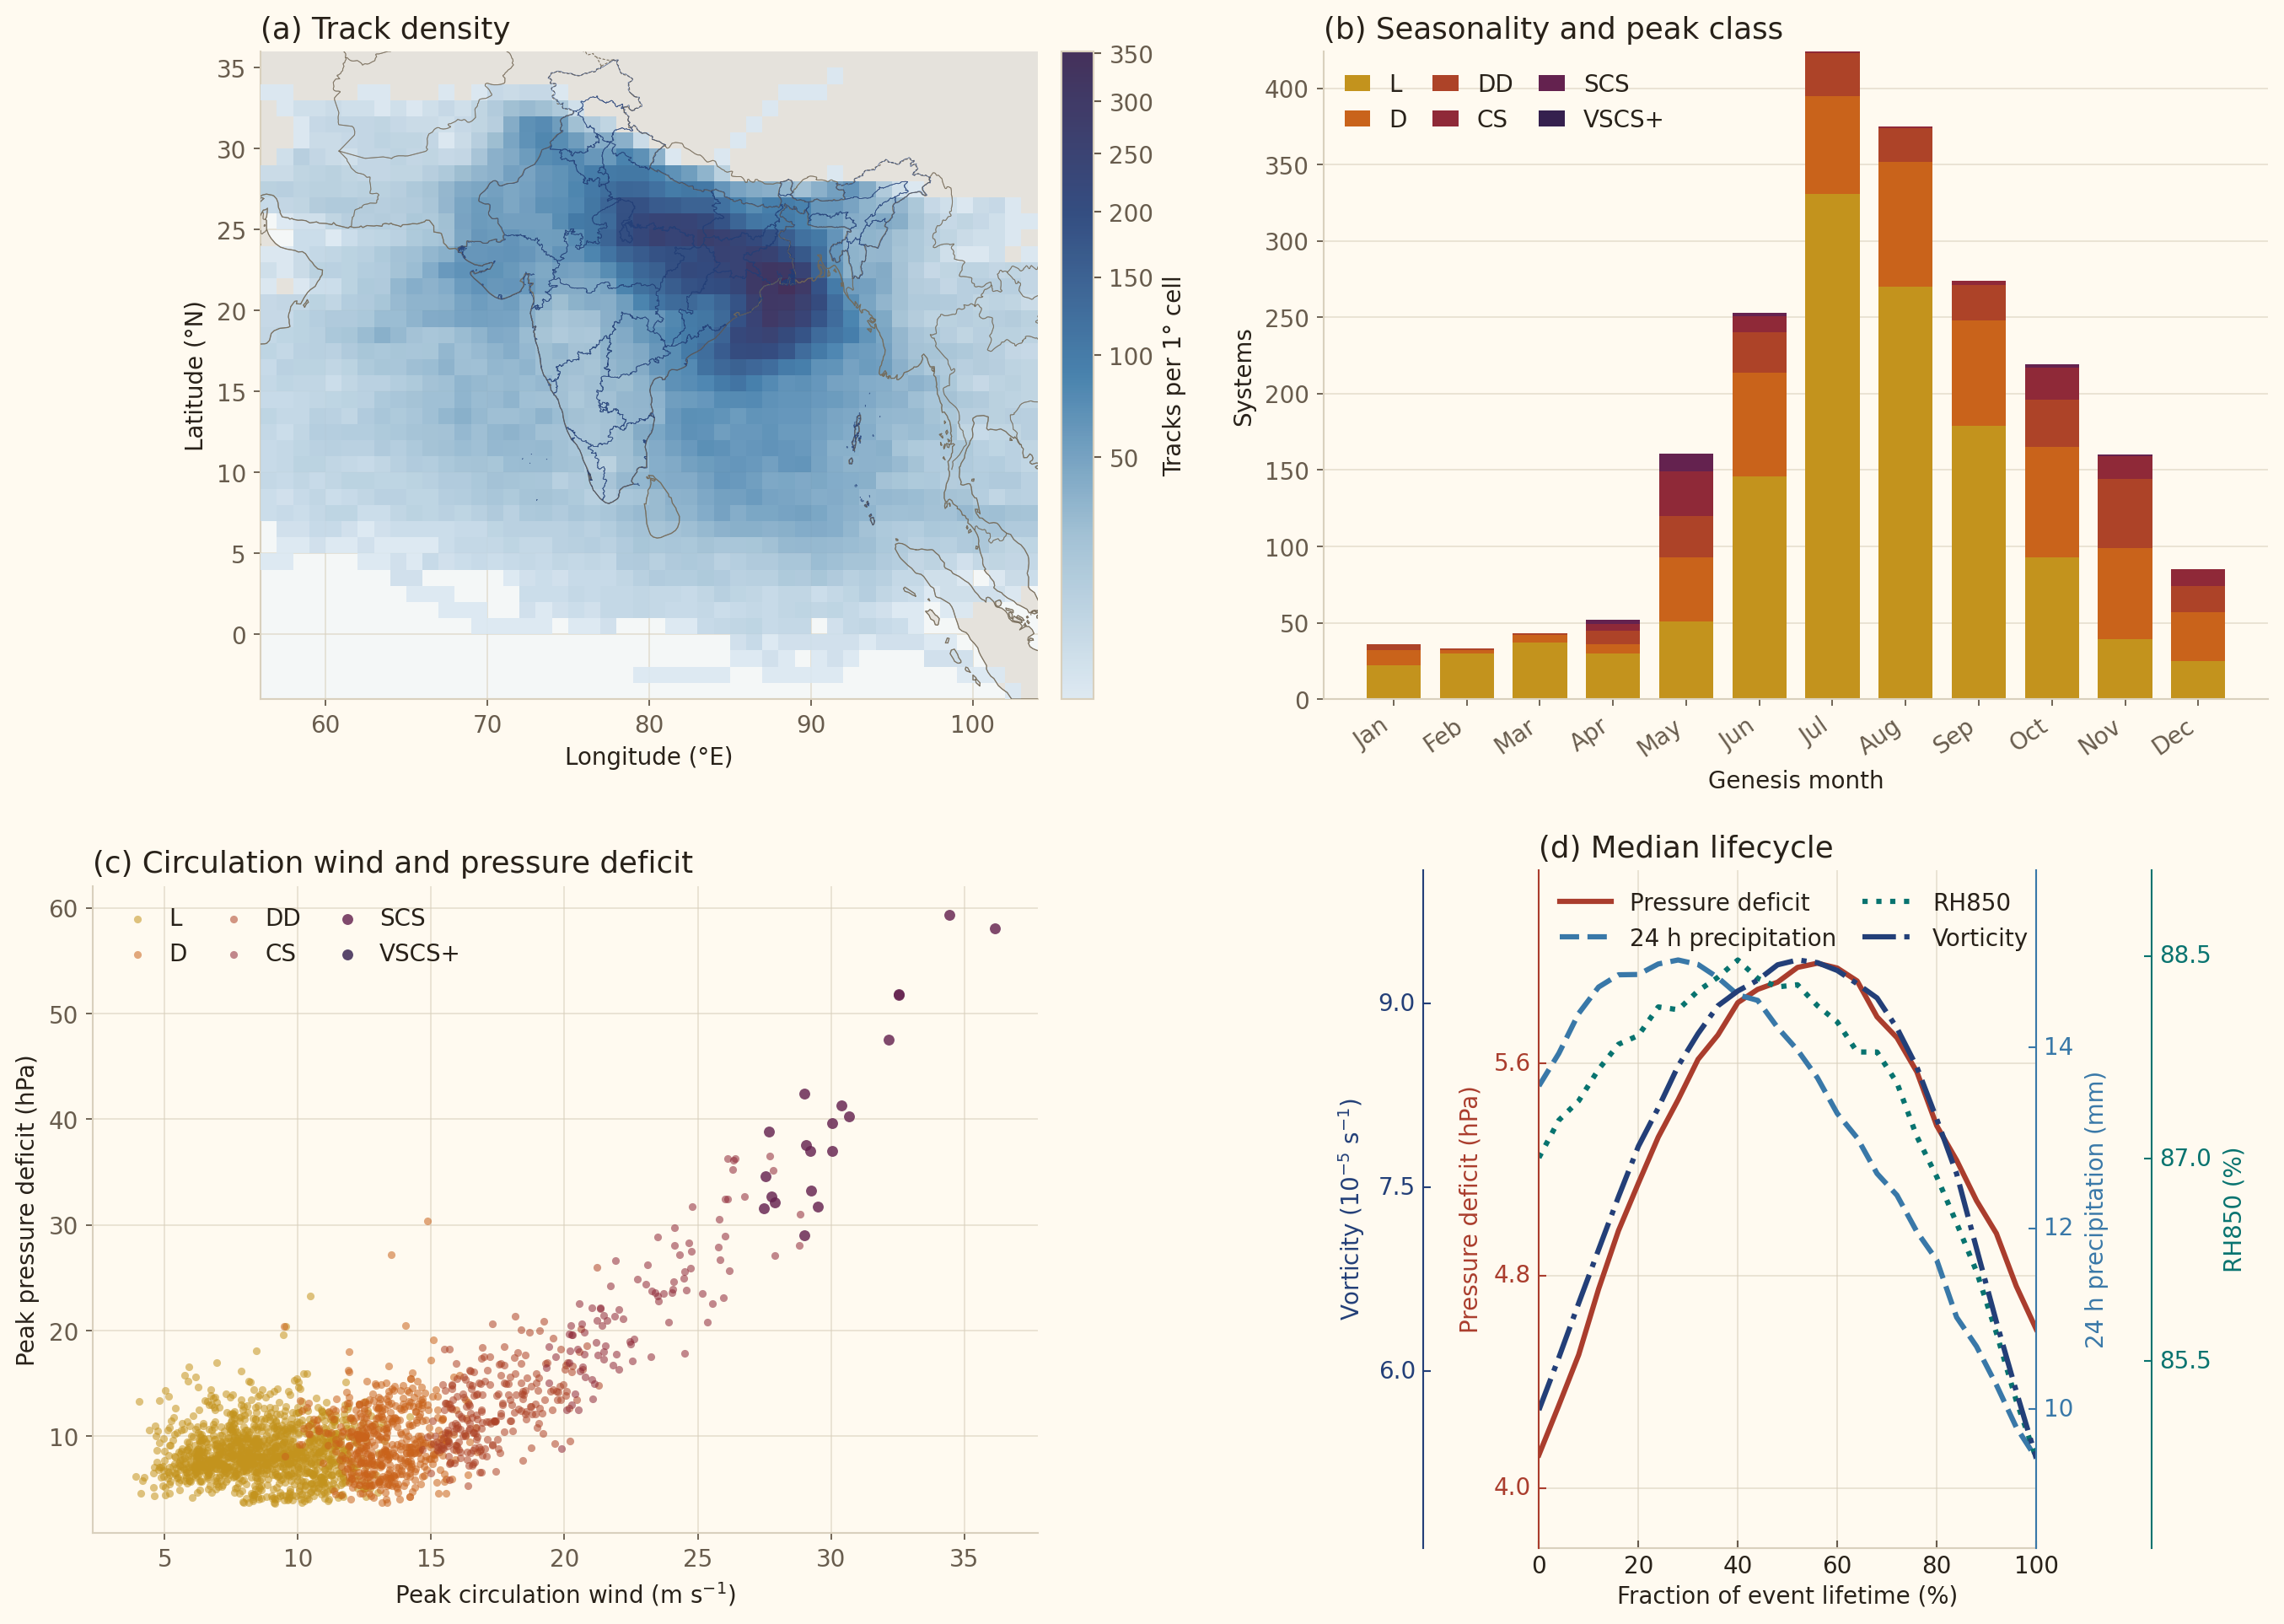
The map shows the current filtered subset. Density counts each track at most once per half-degree cell. Individual systems use a uniform track style throughout.
Select box filters systems whose ERA5 track passes through a drawn region at any point in its lifetime. Drag between two corners, or use arrow keys and Enter to choose each corner; Shift moves faster and Escape cancels. Clear box removes only the region filter.
State rainfall values
Selected-system evolution
Trailing 24 h rainfall is shown as bars unless selected as the line variable. Drag the dashed marker to move map and weather time.
Select a system to inspect its hourly evolution.
Accessible selected-system values
Storm-centred composites
Every contributing track centre is translated to relative longitude 0°, relative latitude 0°; north remains up.
Precipitation footprint
Select a system to load its precipitation footprint.
Vertical structure at 0° relative latitude
Select a system to load its vertical structure.
Subset evolution
Coloured line: subset mean; shading: subset IQR. Dotted line: mean across the complete catalogue. Each system contributes once per life-fraction bin; each y-axis fits the two means and plotted IQR rather than forcing zero.
Physical variables3 shown
Accessible subset summary
Climatology
Frequency, timing, movement, climate context and storm-centred structure for the shared filtered subset.
Annual selected-system frequency
Annual values and centred 11-year mean; years without complete selected-month exposure are excluded.
Accessible annual data
Seasonal cycle and class mix
Each system contributes according to the shared active, genesis or peak-month definition.
Accessible monthly data
Atlas-derived class by decade
Annualised within each exposed decade; category 6 means VSCS or stronger.
Accessible class data
Track density
Unique tracks per half-degree cell for the selected months; colour intensity uses a square-root count scale.
Genesis-to-lysis pathways
Rows are genesis regions; columns are lysis regions. Each row totals 100%.
Accessible pathway data
Climate-state composition
Share of LPS genesis by climate category, compared with all LPSs in the selected time and months.
Accessible climate composition
Current filtered subset
Open this tab to load subset composites.
Complete catalogue reference
Reference composite pending.
Composite method and provenance
Climate change
Under constructionLike-for-like LPS tracking across CMIP6 time slices and published global warming levels.
Models & track subset
Compare physical measures
Values and model selection
Model-by-model change
Paired change; whiskers show each model’s 90% year-resampling interval.
Model change values
Historical agreement with ERA5
Ratio to native ERA5; 1 is exact agreement and the black control shows ERA5 sampled to the common 1° grid.
Historical agreement values
Time-slice response per degree
Each paired percentage change divided by that model’s global warming across the same fixed windows.
Warming-normalised values
Published global warming levels
First 20-year crossing windows relative to 1850–1900, from the IPCC WGI AR6 Atlas.
Global warming level windows
Indian rainfall response
JJAS, with Indian grid cells exposed when an hourly LPS centre lies within 800 km.
Indian rainfall change values
Regional rainfall response
The same JJAS measure across six fixed mainland regions assembled from the atlas state boundaries.
Regional rainfall change values
Peak-time precipitation footprint
Storm-centred trailing 24-hour rain; one peak field per system and one model, one vote.
Historical
Future
Future − historical
Annual comparison
Successive years within each comparison window; model means have one model, one vote.
Genesis seasonal cycle
Mean systems per year by genesis month.
Peak-class mix
Share of systems in each atlas-derived peak class.
Track-density change
Unique tracks per 1° cell per year; systems are grouped by genesis season.
Historical
Future
Future − historical
Model sign agreement
Spatial agreement summary
Related measures
Ensemble changes across every available measure in the selected scientific family.
Related measure values
Rainfall-share drivers
Log-change decomposition into LPS occurrence, exposed footprint, rain intensity and the all-India background.
Rainfall-share decomposition values
Storm-centred vertical profile
Lifecycle-mean track-centred values at the common 850, 700 and 500 hPa levels.
Vertical profile values
Composite expansion
Planned additions include pressure–distance cross-sections of vorticity, relative humidity and θₑ, lifecycle-stage composites and model-resolution stratification. The scalar profiles above are available now from the same track-centred catalogue rows.
Data availability
Capability and all-physics row completeness are shown per comparison; N is repeated on every diagnostic.
Interpretation
Model years are resampled within each paired window; source models receive equal weight. Across-model spread and within-model sampling uncertainty are shown separately. Atlas-derived intensity classes and compact-core quantities are resolution-sensitive, so continuous circulation, pressure, moisture and rainfall measures should lead interpretation.
Catalogue diagnostic extremes
Rankings, distributions, relationships and timing within the ERA5-derived catalogue—not authoritative meteorological records.
Distribution
Filtered-subset distribution with the selected system marked when applicable.
Distribution summary
Distribution by peak class
Boxes show the interquartile range; whiskers show the 5th–95th percentiles.
Class distribution summary
Compound relationship
Every point is a physical event; click a point to open that system.
Move over a point for its system and values.
Timing of the most extreme decile
Genesis month by peak class for the strongest 10% of the filtered subset under the selected ranking direction.
Extreme timing data
Data and definitions
Catalogue
LPS v5.6 contains loading hourly positions grouped into loading calibrated physical events across all calendar months. Every event is continuous at hourly resolution.
Coverage
Scope
Positions, classifications and diagnostics are ERA5-derived.
Identity and physics
track_id is the single public physical-event identifier used for plotting, counts, matching and climatology. Internal linker, family and compatibility identifiers are omitted from the public files.
Map convention
Each event is drawn as one uniform track. ERA5 physics is independently re-sampled at every observed or supported interpolated centre.
Metric definitions
- Peak ERA5 class: persistent six-hour class from the background-removed circulation wind, with a land-only depression floor requiring at least 95% land fraction, two actual closed 2-hPa isobars and 17 kt circulation wind; it is not an official agency classification. DD and stronger classes remain wind-classified. CS means Cyclonic Storm, not Saffir–Simpson Category 1.
- Circulation wind: 95th-percentile 10-m wind anomaly within 125 km after subtracting the mean 300–500 km background vector, m s⁻¹.
- Pressure deficit: environmental ring pressure minus local minimum MSLP, hPa.
- Closed isobars: successive geometrically closed standard 2-hPa ERA5 MSLP contours enclosing the final-centre pressure minimum in a 10° analysis window; this replaces the old pressure-depth proxy.
- MSLP depth: percentile ranking based on minimum mean sea-level pressure; lower pressure ranks stronger.
- Smoothed vorticity: centre diagnostic in 10⁻⁵ s⁻¹.
- 24 h precipitation: trailing track-centred catalogue diagnostic, mm; precipitation does not select or classify v5.6 events.
- Percentiles: fixed across the full v5.6 physical-event catalogue and independently combinable; filters do not rescale them.
Climate filters
BSISO uses the APCC BSISO-1 index on each system’s genesis day during May–October; amplitude below 1 is inactive, while dates outside the season or before the index begins are explicitly unavailable. MJO uses the Australian Bureau of Meteorology all-season Wheeler–Hendon RMM index on each system’s genesis day; amplitude below 1 is inactive, while pre-index and missing values are explicitly unavailable. ENSO uses the NOAA CPC three-month Oceanic Niño Index centred on the genesis month: La Niña at ≤ −0.5 °C, neutral between −0.5 and 0.5 °C, and El Niño at ≥ 0.5 °C. These are genesis-time categories, not a claim that the system was caused by that background state or an official five-season ENSO episode classification.
Weather fields
The map offers positive ERA5 850-hPa vorticity and trailing 24 h accumulated precipitation at 0.25°, plus 500-hPa relative humidity at 1°. Precipitation uses a terrain-inspired kiwi–mango–berry ramp, with near-zero amounts transparent. RH500 is derived from 3-hourly ERA5 temperature and specific humidity using mixed-phase saturation vapour pressure, then interpolated to the hourly slider.
Genesis and lysis regions
Genesis uses the first published centre and lysis the last. Indian land means the endpoint lies inside an atlas state/UT polygon; All land uses the Natural Earth land mask and therefore includes Indian land. Bay of Bengal and Arabian Sea require a water endpoint in 0–30°N and 45–100°E, split at 77.5°E. Indian Ocean means any water endpoint in 30°S–30°N, 30–120°E and includes those two named seas. These are transparent atlas analysis regions rather than official basin classifications.
IBTrACS names
Named systems use NOAA IBTrACS v04r01 North Indian and Western Pacific best tracks. Matches use observed track points at physical-event grain and require credible time overlap, track separation and ambiguity margin. Unmatched systems use atlas class, genesis year and within-class annual sequence, such as DD 1986 03. IBTrACS is display context only and does not select events.
State rainfall
State fills use IMD 0.25-degree daily gridded rainfall. Each event stores the area-mean daily rainfall averaged over UTC calendar days touched by its track; subset maps weight events by active days. The anomaly option is the fractional anomaly (LPS-period rain ÷ calendar-month-matched climatological daily mean) − 1 for each state/UT, using every available IMD year from 1901–2025. Red is below climatology, white is climatology and blue is above; colours saturate at −1 and +1. Rainfall is a downstream atlas diagnostic and does not affect catalogue membership.
Download and provenance
Exports include v5.6 physical-event IDs, units, filter state, source provenance, state rainfall and complete published-centre physics.
Release record
Full dataset on Zenodo · release manifest and checksums · quality report